Requests, Limits and Why Your Pod Got Killed: Kubernetes Resources for Beginners
A beginner walk-through of Kubernetes requests and limits: what the scheduler counts, why CPU gets throttled but memory gets OOMKilled, overcommit, and how node memory pressure evicts pods. Every step reproduces in the Bin Packer lab.
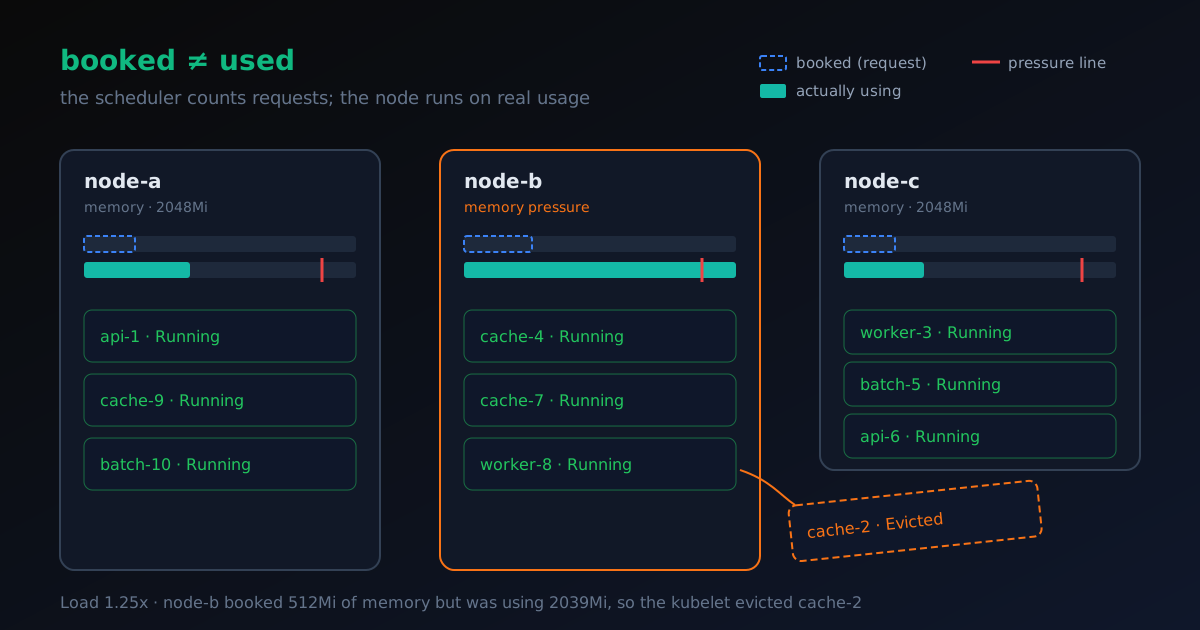
Your pod was fine yesterday. Today it says OOMKilled. Another one is Evicted. A third is running but slow. Nobody changed the YAML, and the node dashboard says there is plenty of room. What happened?
The short answer, in plain words:
- A request is what a pod books. The scheduler adds up bookings to decide where a pod fits. It never looks at what pods actually use.
- A limit is a hard cap. Going over the CPU cap slows the container down. Going over the memory cap gets the container killed and restarted.
- The node runs on what pods really use. When real memory use gets too high, the node removes whole pods to protect itself. That is eviction.
So "it fit" (by bookings) and "it works" (by real usage) are two different questions. Most resource surprises in Kubernetes come from mixing them up.
This post follows one small, made-up workload through all of it. Each "try it" step tells you exactly what to do in the Bin Packer lab, so you can watch it happen instead of taking my word for it.
A note on the examples. All the YAML,
kubectloutput and numbers in this post are illustrations I wrote for this article. None of it comes from a real cluster. The numbers match what the lab shows, so you can check them there.
New to Kubernetes? The 60-second version
A node is a machine (real or virtual) with a fixed amount of CPU and memory.
A pod is a running app: one or more containers that are started together on one node. In this post every pod has one container, so "pod" and "container" mean nearly the same thing.
The scheduler is the part of Kubernetes that picks a node for each new pod. The kubelet is the agent on each node that starts pods and watches over them.
Two units show up everywhere:
| You write | It means |
|---|---|
1000m CPU | one CPU core (m is "millicores", a thousandth of a core) |
250m CPU | a quarter of a core |
1024Mi memory | 1 gibibyte (Mi is a mebibyte, 1024 × 1024 bytes) |
256Mi memory | a quarter of that |
Watch the case on memory units. Mi is mebibytes and M is megabytes. A lowercase m on memory means millibytes, so 400m of memory asks for 0.4 bytes. You almost certainly meant 400Mi.
The train-seat analogy
Think of booking seats on a train. The ticket office only counts seats booked. It doesn't know who actually turns up, or how much luggage they bring. A carriage can be "full" on paper and half empty in real life, or "half booked" and packed to the doors.
The scheduler is the ticket office. Requests are bookings. Real usage is the people and the luggage.
The workload we'll follow
The lab has three identical nodes, node-a, node-b and node-c. Each has 2000m CPU and 2048Mi memory. We queue ten pods made from four kinds:
| Pod | CPU request / limit | Memory request / limit | Uses at normal load |
|---|---|---|---|
api | 500m / 500m | 256Mi / 256Mi | 300m, 80Mi |
worker | 250m / 500m | 128Mi / 512Mi | 300m, 280Mi |
cache | 100m / none | 128Mi / none | 100m, 450Mi |
batch | none / none | none / none | 600m, 120Mi |
Here is what the worker looks like as YAML (illustration):
apiVersion: apps/v1
kind: Deployment
metadata:
  name: worker
spec:
  replicas: 2
  selector:
    matchLabels: { app: worker }
  template:
    metadata:
      labels: { app: worker }
    spec:
      containers:
        - name: worker
          image: example.com/worker:1.0
          resources:
            requests:
              cpu: 250m      # what the scheduler counts
              memory: 128Mi
            limits:
              cpu: 500m      # hard cap: slowed above this
              memory: 512Mi  # hard cap: killed above this
The lab's Load slider multiplies what every pod uses. It never changes requests or limits. That is the whole trick: bookings stay still while real usage moves.
1. The scheduler counts requests, not usage
When a pod is created, the scheduler looks for a node where the pod's requests still fit. It adds up the requests of the pods already there, adds the new pod's requests, and checks the total is no more than the node's capacity. It does this for CPU and memory separately.
The Kubernetes docs are blunt about it: even if actual usage on a node is very low, the scheduler still refuses a pod if the requests don't fit. The reverse is also true, and it is the part that bites. A node can be nearly full in real usage and still accept more pods, because their bookings are small.
Requests are not memory set aside on the machine. Nothing is reserved in RAM. A pod can use less than it booked, or (unless a limit stops it) more.
Try it. Open the lab and leave Load at 1x. All ten pods are Running. Look at node-b: it got cache-2, cache-4, cache-7 and worker-8.
- Memory booked on node-b:
512Mi(three caches at128Mi, plus the worker's128Mi). That's a quarter of the node. - Memory actually used on node-b:
1630Mi. That's 80% of the node.
The scheduler saw a quarter-full node. The node is four-fifths full. The cache pods book 128Mi each but use 450Mi, and they have no memory limit to stop them growing.
A batch pod books nothing at all, so the scheduler treats it as zero and it fits anywhere. It is also promised nothing.
2. CPU over the limit is slowed. Memory over the limit is killed.
Limits are enforced by the Linux kernel on the node, but CPU and memory behave very differently.
CPU is "compressible". If a container wants more CPU than its limit, the kernel simply gives it no more than the limit. The container runs slower. Nothing crashes, nothing restarts. This is called throttling.
Memory is not compressible. You can't hand a program "less memory" for the data it already holds. If a container uses more memory than its limit, the kernel's out-of-memory (OOM) killer stops it. The kubelet then restarts the container, inside the same pod, on the same node. The pod's restart count goes up. You'll see it as OOMKilled.
One real-world detail: memory limits are enforced reactively. The kernel kills the container when it detects memory pressure, so a container can briefly go over its limit before it's killed. The lab kills it instantly, which is a simplification.
Try it: throttling. Move Load to 1.75x. api-1, api-6, worker-3 and worker-8 turn Throttled. Each wants 525m of CPU (300m × 1.75) and has a 500m limit. They keep running, just capped. (Two of the cache pods get evicted at this load too; that's section 4.)
Try it: OOM kill. Move Load to 2x. worker-3 and worker-8 turn OOMKilled. Each now wants 560Mi of memory against a 512Mi limit. The api pods stay Throttled: they want 160Mi, well under their 256Mi memory limit, so memory isn't their problem.
In a real cluster, kubectl describe pod on an OOMKilled pod shows something like this (illustration):
Containers:
  worker:
    State:          Running
    Last State:     Terminated
      Reason:       OOMKilled
      Exit Code:    137
    Restart Count:  3
    Limits:
      cpu:     500m
      memory:  512Mi
    Requests:
      cpu:     250m
      memory:  128Mi
Same pod name, same node, higher restart count. If the app keeps needing more than its limit, it keeps getting killed, and Kubernetes starts waiting longer between restarts (CrashLoopBackOff).
3. Overcommit: limits can add up to more than the node has
The scheduler checks that requests fit. It doesn't check limits at all. So the limits of all the pods on a node can add up to much more than the node has. That's called overcommit, and it's normal. It's a bet that not every pod will hit its limit at the same time.
A pod with no limit is the extreme case. A cache pod with no memory limit can, in principle, try to use the whole node.
Try it. Turn on Advanced in the lab. Each node now shows a purple Σ limits marker and a line like Σ limits 512Mi + unbounded (overcommitted). Node-b's limits are "unbounded" because the caches have no memory limit. Requests can never overcommit a node (the scheduler won't allow it). Limits can, and usually do.
Overcommit is fine until real usage actually climbs. Then the node itself has to do something.
4. Node memory pressure: the kubelet evicts whole pods
The kubelet keeps an eye on how much memory is left on the node. When free memory drops below a threshold, the node is under memory pressure, and the kubelet starts removing pods to get back under it. On Linux the default hard threshold is when available memory drops below 100Mi. The lab uses a bigger line (1792Mi used out of 2048Mi) so it's easy to see.
Eviction is not the same as an OOM kill:
- The kubelet marks the evicted pod
Failedand stops it. The whole pod is gone. It isn't restarted. - If a controller such as a Deployment owns the pod, the controller notices it has one replica too few and creates a new pod with a new name. The scheduler places that new pod like any other, maybe on a different node.
- A pod with no controller (a "bare" pod you created directly) just stays gone.
Who gets evicted first?
Per the node-pressure eviction docs, the kubelet ranks pods by:
- whether the pod's usage is above its request,
- then the pod's priority,
- then how far its usage is above its request.
So pods using more than they booked go first, and among those, the one furthest over its booking goes first (when priorities are equal, as in the lab). Pods using less than they booked go last.
Try it. Move Load to 1.25x and watch node-b. Each cache now uses 563Mi, and the node's real memory use reaches 2039Mi, over its 1792Mi line. The kubelet ranks node-b's pods:
| Pod | Uses | Booked | Over its booking by |
|---|---|---|---|
cache-2 | 563Mi | 128Mi | 435Mi |
cache-4 | 563Mi | 128Mi | 435Mi |
cache-7 | 563Mi | 128Mi | 435Mi |
worker-8 | 350Mi | 128Mi | 222Mi |
The caches tie. The lab breaks the tie by queue order, so cache-2 is Evicted. That frees 563Mi, and node-b drops to 1476Mi, back under the line. The other pods are left alone. The lab's "What changed" box shows node-b went over its memory-pressure line and cache-2: Running → Evicted on node-b.
Push to 1.75x and evicting one cache isn't enough any more: cache-4 goes too.
Now drop Load back to 1x. cache-2-r1 and cache-4-r1 appear, Running. Those are the replacement pods the Deployment created. The -r1 is there to remind you each is a new pod, not the old one coming back. (In a real cluster the replacement is created straight away and scheduled fresh. The lab waits until the load drops so you can see the difference.)
Notice that every pod on node-b fit. Nobody broke a rule the scheduler checks. The bookings were just far smaller than the real usage.
5. QoS classes, briefly
Kubernetes gives every pod a Quality of Service (QoS) class based on its requests and limits:
| Class | Rule | Our pods |
|---|---|---|
Guaranteed | every container has CPU and memory requests and limits, and each request equals its limit | api |
Burstable | not Guaranteed, but at least one request or limit is set | worker, cache |
BestEffort | no requests or limits at all | batch |
The QoS docs describe the usual eviction order as BestEffort first, then Burstable, then Guaranteed. The eviction docs add the important detail: the kubelet doesn't actually sort by QoS class. It uses the usage-versus-request ranking from section 4. QoS is a good estimate of that order, because:
- a BestEffort pod books nothing, so any memory it uses is "over its request",
- a Guaranteed pod's memory limit equals its request, so it can't get far over its booking.
QoS changes the order. It doesn't make any pod immune. A Guaranteed pod can still be throttled at its CPU limit (watch api-1 at 1.75x). It can still be OOMKilled if it goes over its own memory limit. And the kubelet can evict it as a last resort, for example when system processes on the node use more memory than was set aside for them.
Restart, or replacement?
These two get mixed up all the time, so here they are side by side:
| OOMKilled | Evicted | |
|---|---|---|
| Caused by | this container going over its own memory limit | the node running short of memory |
| Who acts | the kernel, then the kubelet restarts it | the kubelet |
| What's removed | one container | the whole pod |
| Same pod afterwards? | yes, same name, restart count goes up | no: a controller makes a new pod; a bare pod is gone |
| Can land on another node? | no | the replacement can |
Where the lab simplifies
The lab is a teaching model. It leaves out several things real Kubernetes does:
- It is a snapshot, not a timeline. OOM kills and evictions happen instantly.
- Every pod has one container, restarts always, is owned by a Deployment and has the same priority.
- Nodes offer their full capacity to pods. Real nodes hold some back for the system (the difference between capacity and allocatable).
- When pods compete for CPU on a busy node, real Linux shares it out in proportion to their CPU requests. The lab doesn't model that.
- No priority and preemption, taints, or affinity rules.
- Replacements show up only when load drops, and the whole queue is placed again in order.
What to take away
- Set requests close to what the app really uses. Requests that are far too low are how node-b got into trouble: the scheduler packed it full of pods that used far more than they booked.
- Set a memory limit you expect the app to stay under. Going over it is a kill, not a slowdown.
- Treat CPU limits as a throttle. They protect neighbours, but a limit that's too tight just makes the app slow.
- When you see
OOMKilled, look at the container's memory limit. When you seeEvicted, look at the node and at pods using far more than their requests.
Then open the Bin Packer lab, queue a few pods of your own and see if you can predict what happens before you move the slider.
Word list
- Request: what a pod books. The scheduler counts it. Nothing is reserved in RAM.
- Limit: a hard cap enforced by the kernel.
- Throttled: wanted more CPU than its limit, so it was slowed down.
- OOMKilled: used more memory than its limit, so the container was killed and restarted in the same pod.
- Memory pressure: the node is low on free memory.
- Evicted: the kubelet removed the whole pod to relieve node pressure.
- Overcommit: limits on a node adding up to more than the node has.
- QoS class: Guaranteed, Burstable or BestEffort, worked out from requests and limits.
Sources
- Kubernetes docs: Resource Management for Pods and Containers
- Kubernetes docs: Pod Quality of Service Classes
- Kubernetes docs: Node-pressure Eviction